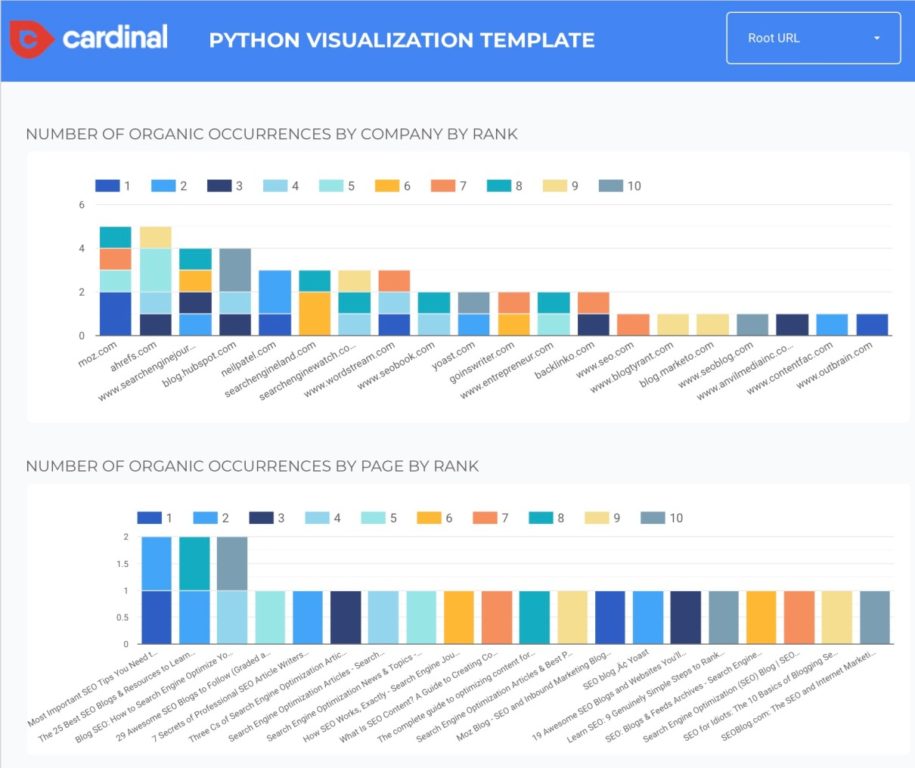
Cardinal Digital Marketing has developed a Data Studio template for digital marketers to use to help investigate sudden ranking drops. John, Cardinal’s SEO Director, wrote an a how-to guide on Search Engine Journal about how to use Python programming to investigate which pages are ranking well for targeted keywords.
Below are instructions on how to take the raw Python data and put them into Google Data Studio for powerful visualizations.
Step 1) Open & Copy Our Google Sheets Template
Before you edit anything, you’ll need to open our Google Sheets template. Please DO NOT request access, as it will not be accepted and will waste your time. To access and edit this template, follow these instructions:
- Open this link to our Google Sheets template.
- Click File => Make a Copy.
- On your new version of your Google Sheet, paste your raw python data in columns A-C starting on row 2.
- The rest of the columns, highlighted in gray, should automatically update.
Step 2) Open & Copy Our Google Data Studio Template
You’re almost there! To start getting visual insights to into which competitor pages are outranking you, follow these steps below.
- Open this link to our Data Studio template.
- At the top of the page, click the make a copy image icon.
- This will generate a popup and ask you to select a “New Data Source.” Click on the dropdown and select “Create New Data Source” at the bottom.
- As a data source, find and select Google Sheets.
- Find your raw data sheet and select that as your data source.
- This may take a moment to process, but from here your data will update with your Python results.

